
How to measure loyalty program success: four numbers and one fair test
 Oleksii Andriiuk
Founder
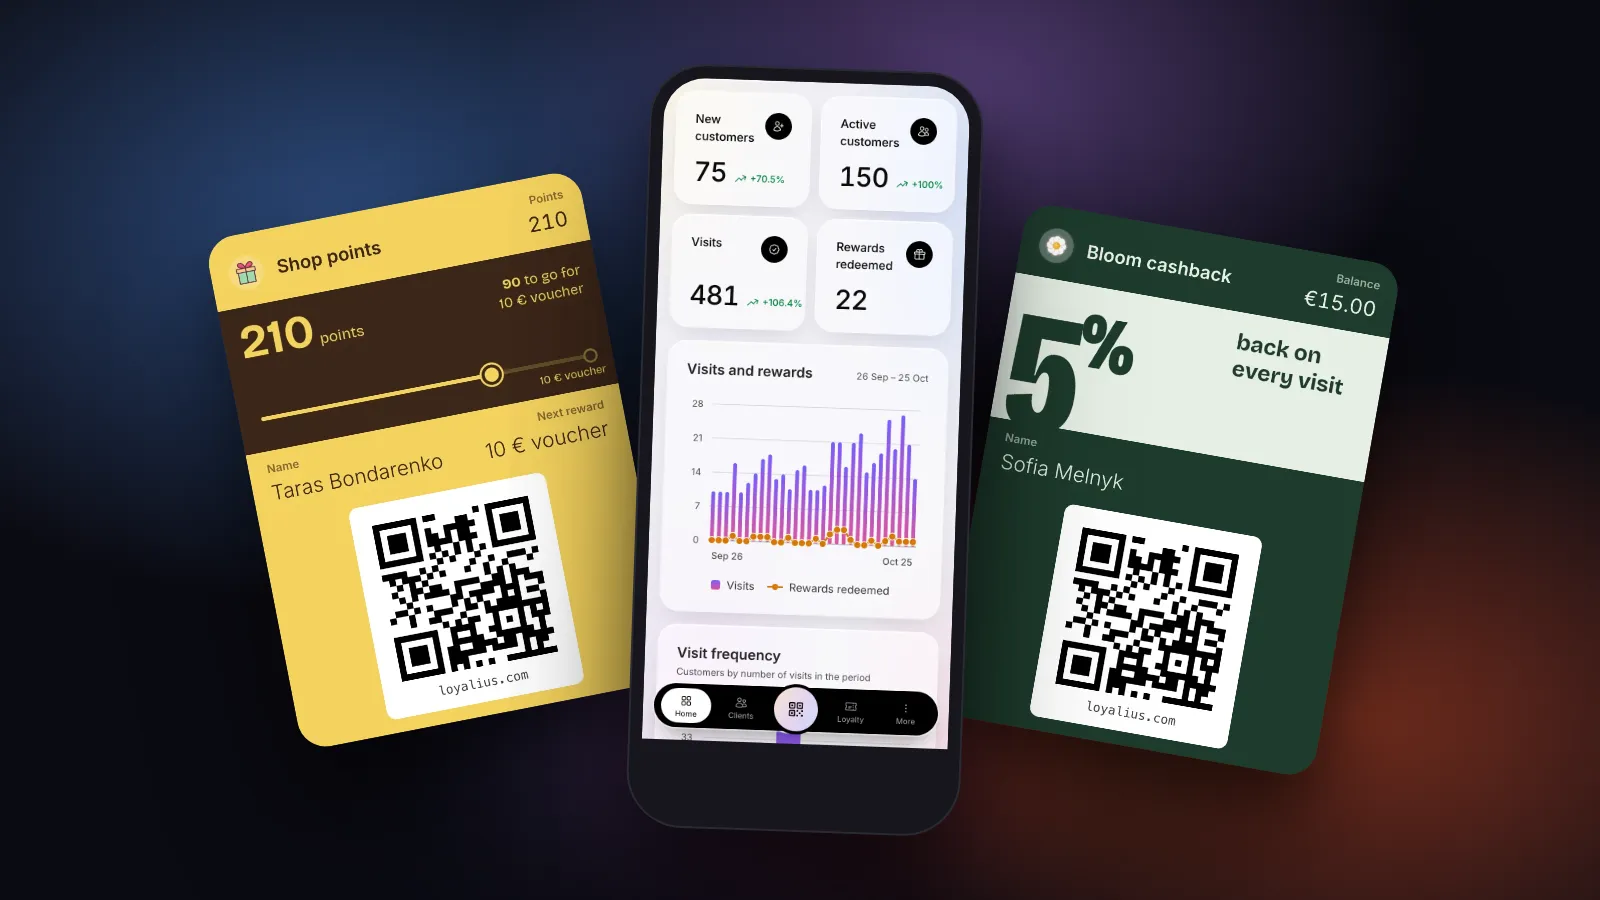
If you want to measure loyalty program success in a shop, four numbers are enough: how many sales go through the card, how many new members come back, whether the days between visits get shorter, and what the rewards cost you. Then run one fair test, a message sent to most customers and held back from a few, to see what the programme adds on its own. The number most owners look at first, cardholders spending more than everyone else, proves almost nothing.
I spent part of this morning reading the guides that rank for this question in November 2026. Most of them list between five and thirteen metrics written for online stores with a data team: lifetime value, share of wallet, expected future profit. A bookshop or a shoe shop with one till and a points card does not need any of that. It needs a few numbers that fit on a sticky note on Monday morning, and a way to stop flattering itself.
The number that flatters every programme
Cardholders always look better. In almost every shop, people with the loyalty card spend more and visit more often than people without it, and it is tempting to give the card the credit.
Most of that gap is not the card. The people who say yes at the till are the people who were going to come back anyway: the regular who buys a novel every other Saturday joins on day one, the tourist buying a city map does not. Compare the two groups and you are mostly measuring who your regulars were before you printed the poster.
So I'd drop "cardholders vs everyone else" completely. Compare the same customers with themselves over time, and compare a group that got something with a group that did not.
Which numbers measure loyalty program success?
Four numbers, checked once a month, each answering one question. The figures below are an example for a bookshop with a points card; yours will be different.
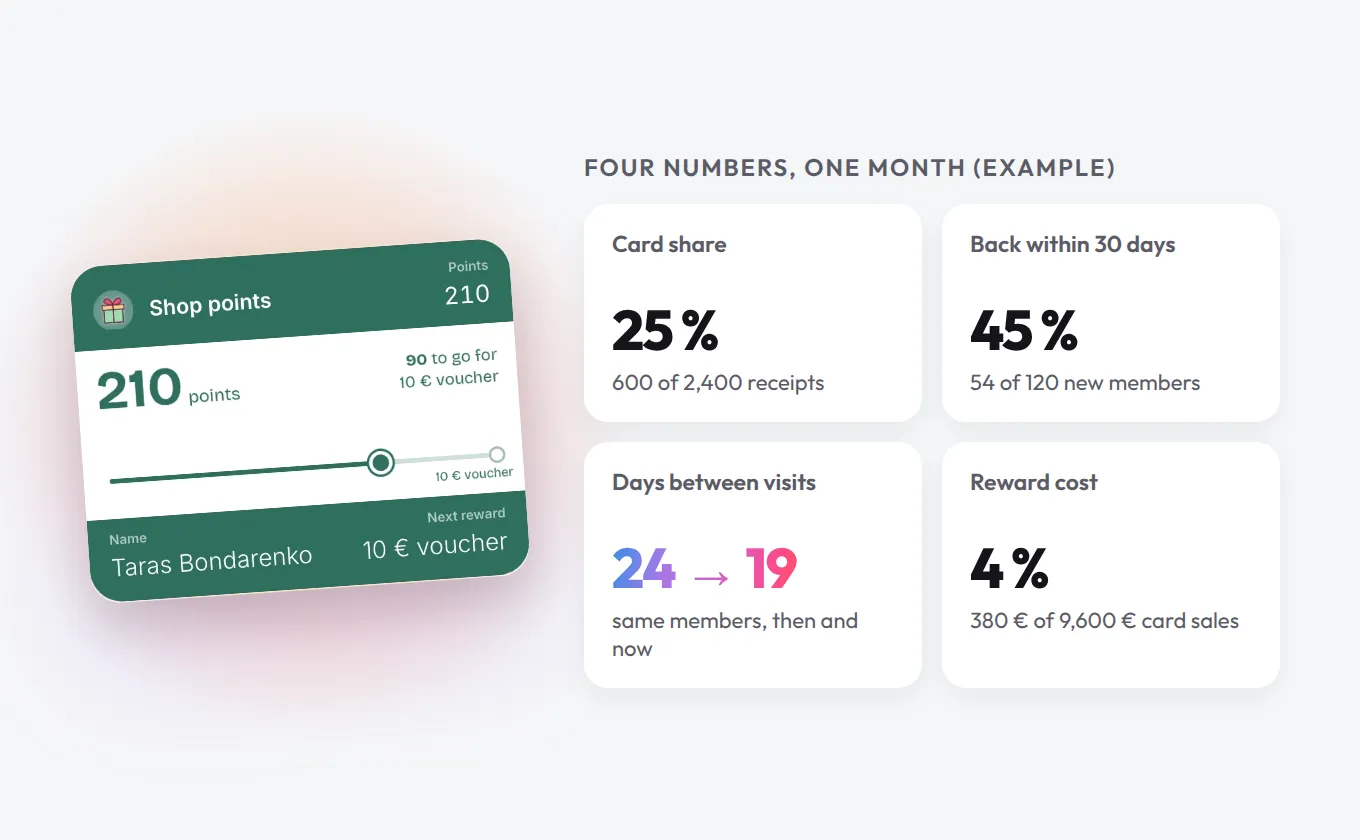
| Number | How to get it | Example | What it tells you |
|---|---|---|---|
| Card share | card sales ÷ all receipts | 600 of 2,400 = 25 % | whether staff offer the card |
| Second-visit rate | new members who return within 30 days | 54 of 120 = 45 % | whether the first reward feels reachable |
| Days between visits | average gap for the same members, first month vs now | 24 → 19 days | whether the card changes behaviour |
| Reward cost | rewards redeemed ÷ cardholder sales | 380 € of 9,600 € = 4 % | whether you can afford it |
What share of sales should go through the card?
There is no target worth copying from another shop; the trend matters more than the level. Card share should climb for the first few months and then hold steady. If it stalls, the cause is usually the ask at the till rather than the card, so fix the ask first. Split it by shift and the difference usually points to a person, not a policy.
Why is the second visit the one to watch?
The second visit is where a card becomes a habit or a forgotten name in Wallet. I'd treat a second-visit rate below a third as a warning: the first reward is too far away, or nobody tells new members how close they already are. Before lowering the reward, try a few welcome points on the first purchase.
Days between visits
This is the number that shows the card is changing anything. Take the members who joined in, say, August, and compare the average gap between their visits in their first month with the gap now. Same people, before and after, so the regulars-versus-tourists problem disappears.
Watch the calendar, though. Visit gaps shrink for everyone in December and grow for everyone in January, card or no card, so compare months that are alike.
Reward cost
Divide what the redeemed rewards cost you by what cardholders spent. Count a money-off voucher at its full value and a free item at what it costs you to make; the stamp card maths explains why the two are different. If this share creeps up month after month while visits stay flat, either the reward is too generous or someone behind the counter is generous with points.
Does the loyalty program pay for itself?
Turn the shorter visit gap into money. In the bookshop example, 300 active cardholders who came every 24 days now come every 19 days. That is 1.25 visits a month becoming about 1.58, or roughly 100 extra visits a month across the 300 people.
| Example, one month | Amount |
|---|---|
| About 100 extra visits × 22 € average basket | about 2,200 € of sales |
| Gross margin at 40 % | about 870 € |
| Vouchers redeemed | − 380 € |
| Loyalty software (Starter plan) | − 19 € |
| Left over | about 470 € |
Be honest about the weak spot of this sum: some of those 100 visits would have happened anyway, thanks to a good autumn or one bestseller everyone wanted. Before-and-after is much fairer than cardholders-versus-everyone, but it still gives the card some credit it did not earn. That is what the next test is for.
The fair test: hold a few people back
To know whether a message or an offer brought people back, send it to most of the customers it is meant for and hold back a small random group who get nothing. Then count how many came back in each group over the same two weeks. The difference between the groups is what the message did.
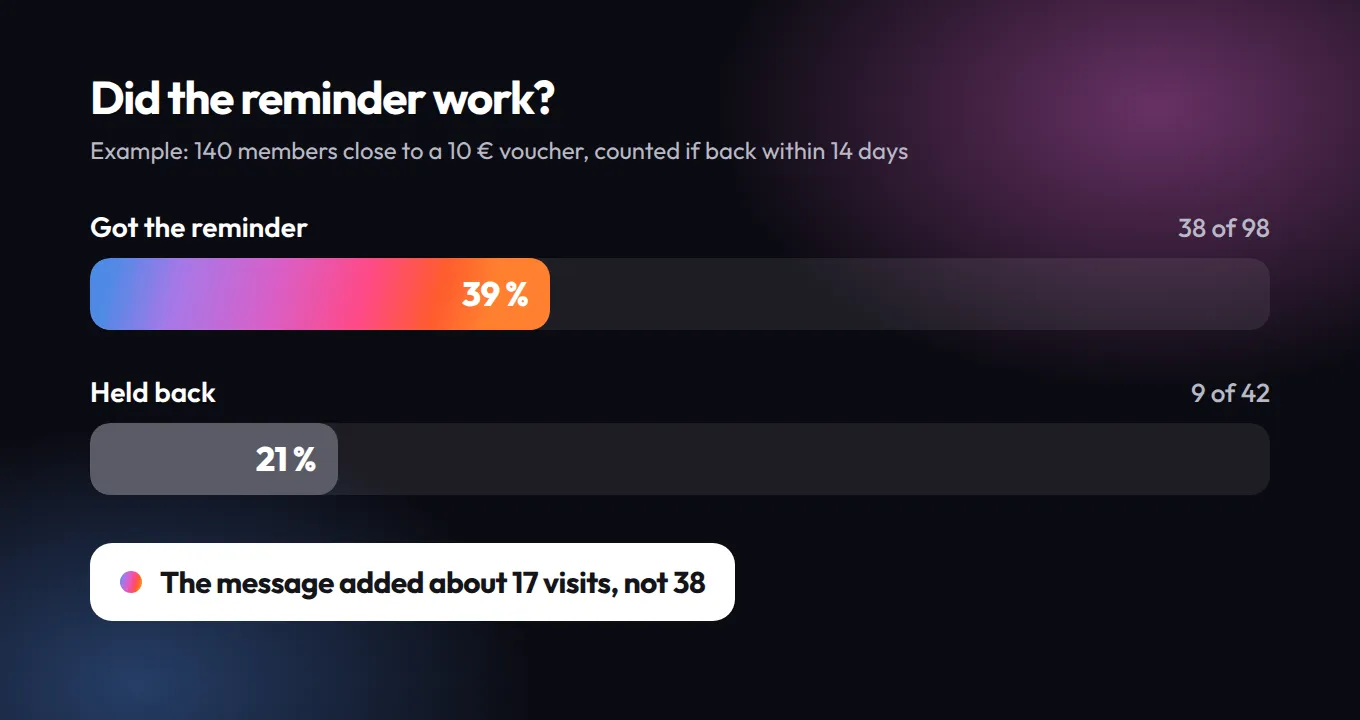
An example: 140 members are within 40 points of a 10 € voucher. 98 get a reminder on the lock screen, 42 are held back. Within 14 days, 38 of the 98 come back (39 %) and 9 of the 42 do (21 %). Without the held-back group you would credit the message with 38 visits; with it, you know it added about 17.
Two rules keep the test honest. Pick the held-back group at random, never by hand. And with small groups, a difference of a few people can be luck, so repeat the test before you believe it.
In Loyalius, a loyalty platform that puts stamp, points and cashback cards in Apple Wallet and Google Wallet, this test is built in: the "Did it work?" result on the Growth plan and above compares the customers who got a message with a held-back group, and counts a customer as back if they visit within 14 days. The home dashboard shows new and active customers, visits and rewards redeemed each month, and a CSV export gives you the rest of the four numbers.
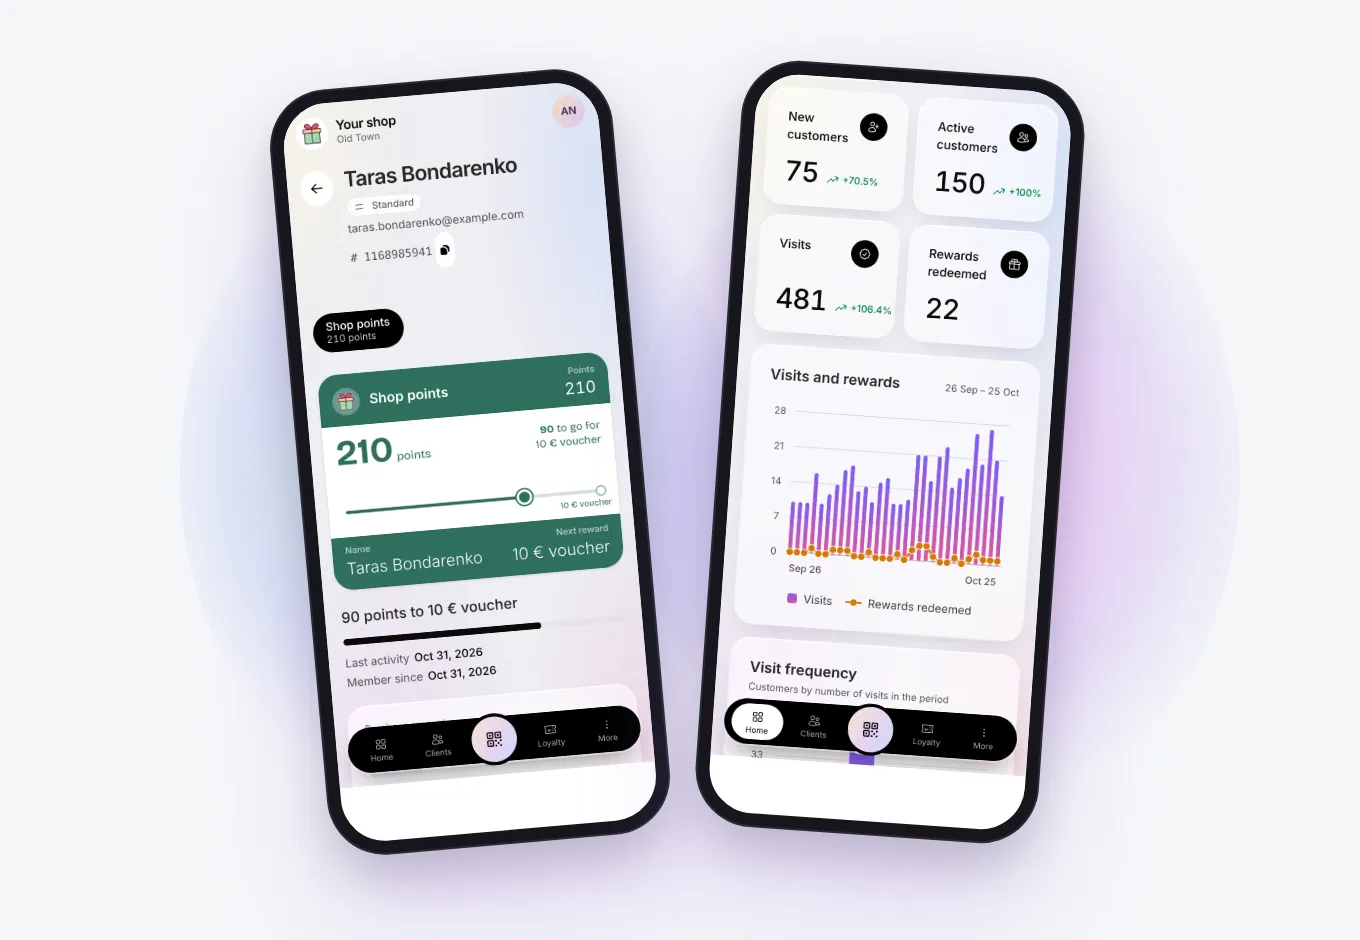
If you run several shops, put the four numbers for each branch side by side once a month. The branch with the lowest card share is rarely the one with the fewest customers; it is the one where nobody asks. There is more on comparing branches in the rollout plan for multiple locations.
Questions about the numbers
How long before a loyalty program shows results?
Give it three full months before you judge it. The first weeks mostly sign up regulars who would have come anyway; the second-visit rate means something after about six weeks, and the visit gap needs at least two months of visits per customer.
What is the ROI of a loyalty program?
The return of a loyalty program is the margin on the extra visits minus what the rewards and the software cost. Count only the extra visits, not every cardholder visit, and the answer is smaller than most sales pages suggest but much more useful.
Can I measure a loyalty program without a till connection?
Yes. When staff scan the card on a phone, every visit, point and reward is counted on the card, so three of the four numbers need nothing else. For card share you only need the receipt count from your till's daily report.
Should I compare loyalty members with non-members?
Not to judge the programme, because the people who join were already your better customers. Use that comparison only to see who your regulars are, and judge the programme by the same members over time and by held-back tests.
Write November down this week
December will flatter every number you have: more visits, bigger baskets, fuller cards. So this week, before the rush, write down the four numbers for the last four weeks, on paper or in a note on your phone. In February, compare with that note, not with December, and look at the shares (card share, second-visit rate, reward cost) more than at raw visits, because February is quiet everywhere. I think that one comparison will tell you more about your programme than any report you could buy, and it costs you ten minutes. If you want to run the held-back test yourself, the plans and the 30-day free trial are on the pricing page.
More stories
 Regular customers stopped coming? How to spot it early and win them back
Lost regulars rarely leave in anger. How to see who has gone quiet, why they drift away, and how to bring them back with one small reason and a date.
 Should you close your restaurant on slow days? Do this sum first
Quiet Mondays? Work out what the day really earns, how many guests would beat closing it, and how to fill it if it is worth keeping. A bistro example.
 How to get staff to upsell when they hate sounding pushy
Staff never recommend anything? Give them one product, one sentence and one moment at the till each week, then count. A bakery example with the sums.