
One store underperforming? Split its sales into three numbers before you fix anything
 Oleksii Andriiuk
Founder
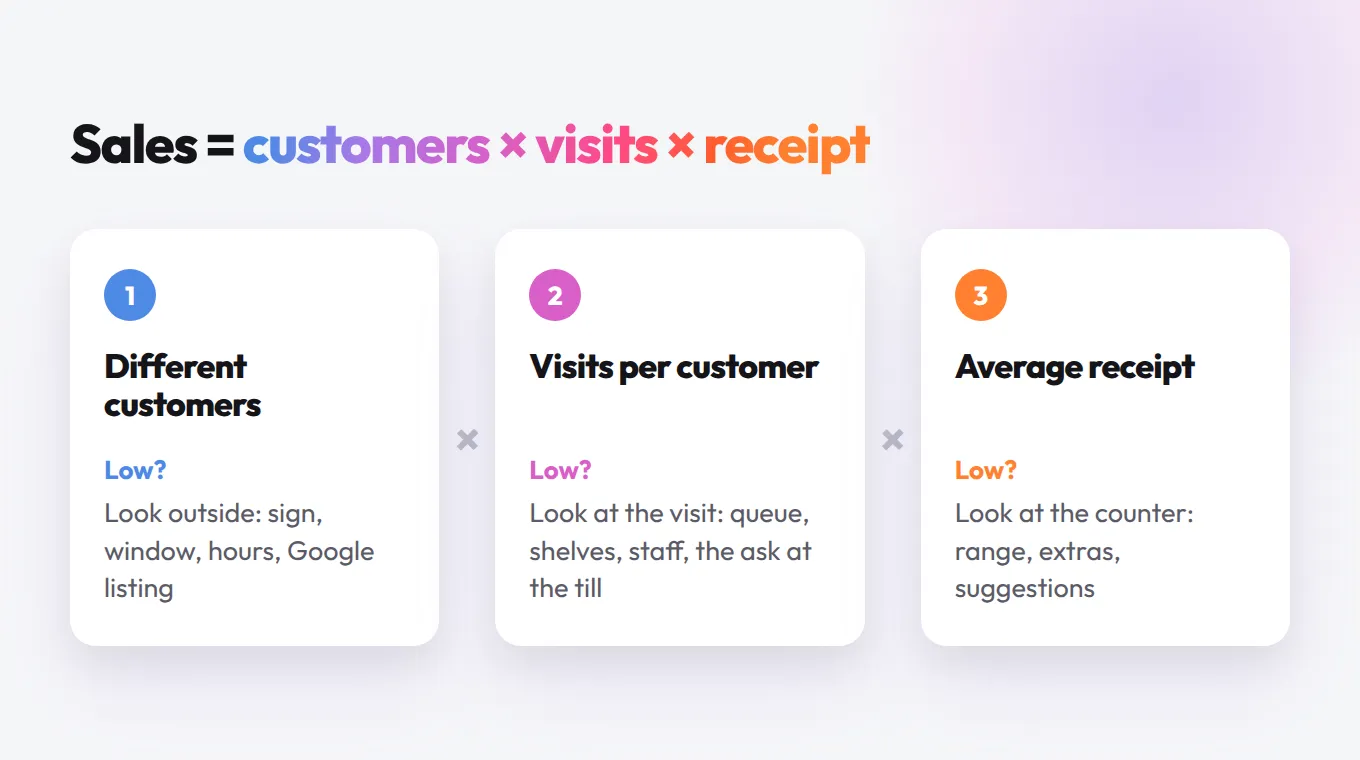
When one store is underperforming and the others are doing fine, the cause is rarely "the location" in general. Split that store's monthly sales into three numbers: how many different customers buy there, how often each of them comes back, and how much they spend per visit. Compare each with your typical branch, and the number that lags furthest tells you where to look: the street and the listing, the visit that should bring people back, or the counter.
The usual reactions to a weak branch are a discount campaign or quiet doubts about its manager. I would do neither until I had those three numbers: a discount fixes one of them at best, and the manager may be fighting a problem nobody has named yet. (If you are still putting one card into all your shops, start with the rollout plan for multiple locations.)
Compare the weak branch fairly first
The chain average is the wrong yardstick: one strong flagship pulls it up and makes normal branches look bad. Compare instead with your typical branch (the one in the middle when you sort them by sales) and with the same branch in the same weeks last year.
Month-on-month changes say least of all. In September 2026 the volume of retail sales fell by 0.7 % in the euro area compared with August, according to Eurostat's release of 6 November 2026. A dip like that hits every shop, so a branch that sold less than last month has told you nothing yet. A branch that sells a fifth less than its sisters, month after month, has.
Two more rules keep the comparison honest:
- Compare like with like. A shop by a station and one on a residential street have different days, hours and baskets.
- Leave new branches alone for their first year. Regulars take months to form.
How do you find out why one store is underperforming?
You split its sales into customers, visits and the average receipt, because monthly sales are always those three multiplied together. Every till gives you the number of receipts and the average receipt per branch. How many different people those receipts belong to is the number most chains do not have.
- Take the number of receipts and the average receipt for each branch for the last full month, from the till.
- Get the number of different customers. A loyalty card is the cleanest source: for its members, it shows who bought where and how often. Members are a sample, not everyone, but comparing branch with branch on the same sample is fair. Without a card, ask "is this your first time here?" at the till for two weeks and keep a tally.
- Divide receipts by different customers to get visits per customer.
- Put the weak branch next to your typical branch and work out how much of the gap each number explains.
A worked example: six delis and one weak branch
Take a regional chain of six neighbourhood delis, call it Lipa Deli, selling bread, cheese, cold cuts, coffee beans and ready meals. Five branches sell around 87,000 € a month. Branch 5, on a residential street that is newer than the rest of the town, has been open for 18 months and sells about 66,000 €. These are example numbers, so put your own in their place.
| Last month | Typical branch | Branch 5 |
|---|---|---|
| Different customers | 1,500 | 1,600 |
| Visits per customer | 4.0 | 3.0 |
| Receipts | 6,000 | 4,800 |
| Average receipt | 14.50 € | 13.80 € |
| Sales | 87,000 € | 66,240 € |
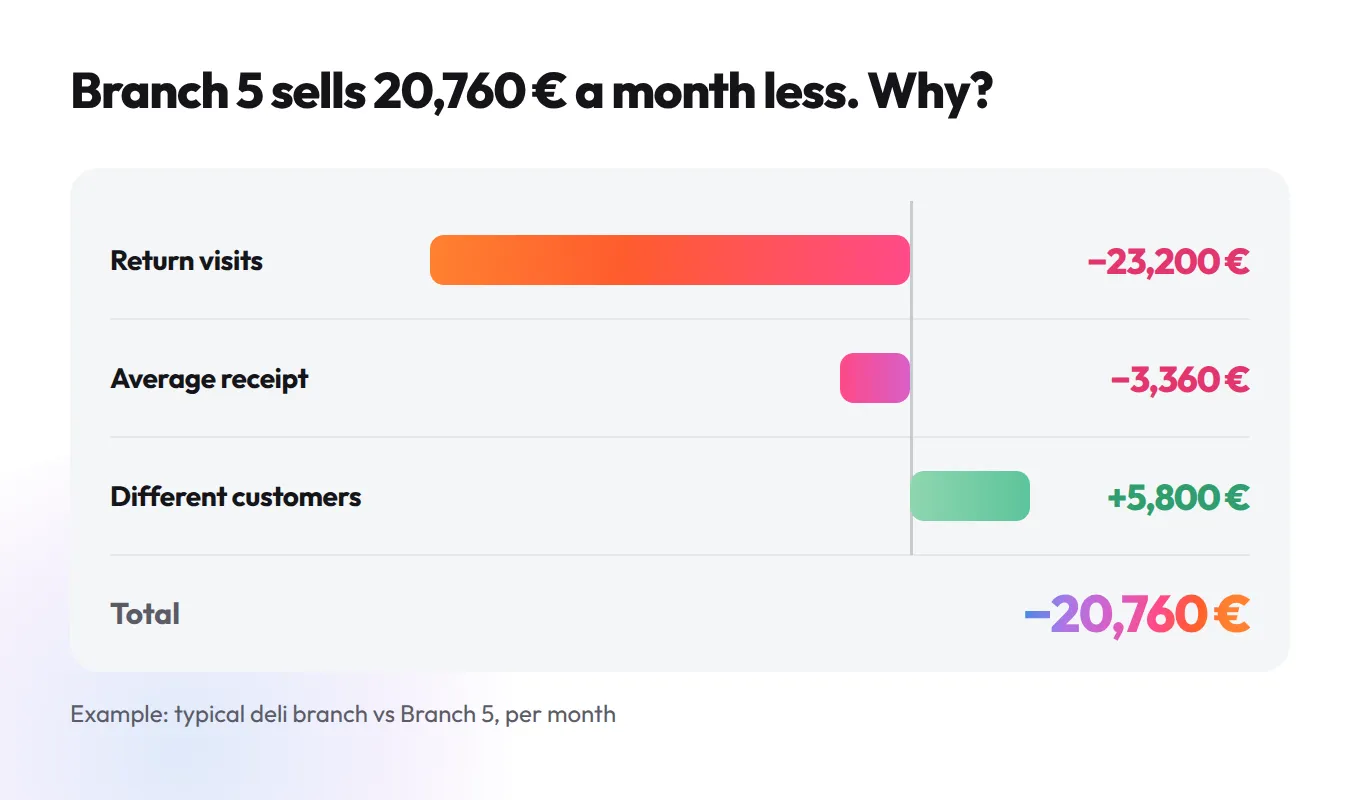
The gap is 20,760 € a month. Change one number at a time, from Branch 5's value to the typical one, and you see where it comes from.
| Number | Branch 5 vs typical | Effect on sales |
|---|---|---|
| Different customers | 100 more | +5,800 € |
| Visits per customer | 1.0 fewer | −23,200 € |
| Average receipt | 0.70 € lower | −3,360 € |
| Total | −20,760 € |
Branch 5 does not have a footfall problem: more different people shop there than at the typical branch. It has a coming-back problem worth about 23,200 € a month, and a small basket problem on top. A discount flyer for new customers would have spent money on the one number that was already fine.
If fewer people come in
If the weak branch has clearly fewer different customers, the problem is outside the door, and a loyalty card will not solve it: a card brings people back, it does not make strangers find you. Look at what someone walking or driving past sees.
- The sign and the window. Can you tell from across the road what the shop sells and whether it is open?
- Opening hours that match the street. A residential street wants an early start and a late close; an office street is dead on Saturdays.
- The branch's own Google listing. Every branch needs its own profile with its own hours, photos and reviews, and Google lets a chain manage them together in business groups. A branch with twelve reviews next to sisters with three hundred is easy to miss on the map.
If customers come once and do not return
This was Branch 5's problem, and it is the one a chain can do the most about, because the customers have already found the shop.
Why do customers stop coming back to one branch?
Usually because something on the first or second visit is different at that branch, and it is rarely the products. It is the queue at the busy hour, the empty bread shelf at six in the evening, the new face behind the counter every month. Staff gaps are a real candidate: in the second quarter of 2026, 2.5 % of jobs in EU accommodation and food services were vacant and 1.8 % in wholesale and retail trade, according to Eurostat's job vacancy release of 15 September 2026. A branch running one person short shows it in return visits long before it shows it in sales.
What to check, in this order:
- Stand in the branch during its busiest hour and count how long people wait. Then do it at the hour before closing and look at the shelves.
- Compare staff turnover with the other branches. If the weak branch has had three managers in a year, that is your answer.
- Listen to the till. Does anyone ask for the loyalty card, mention a weekly special or say goodbye by name? If not, fix the ask at the till before anything else.
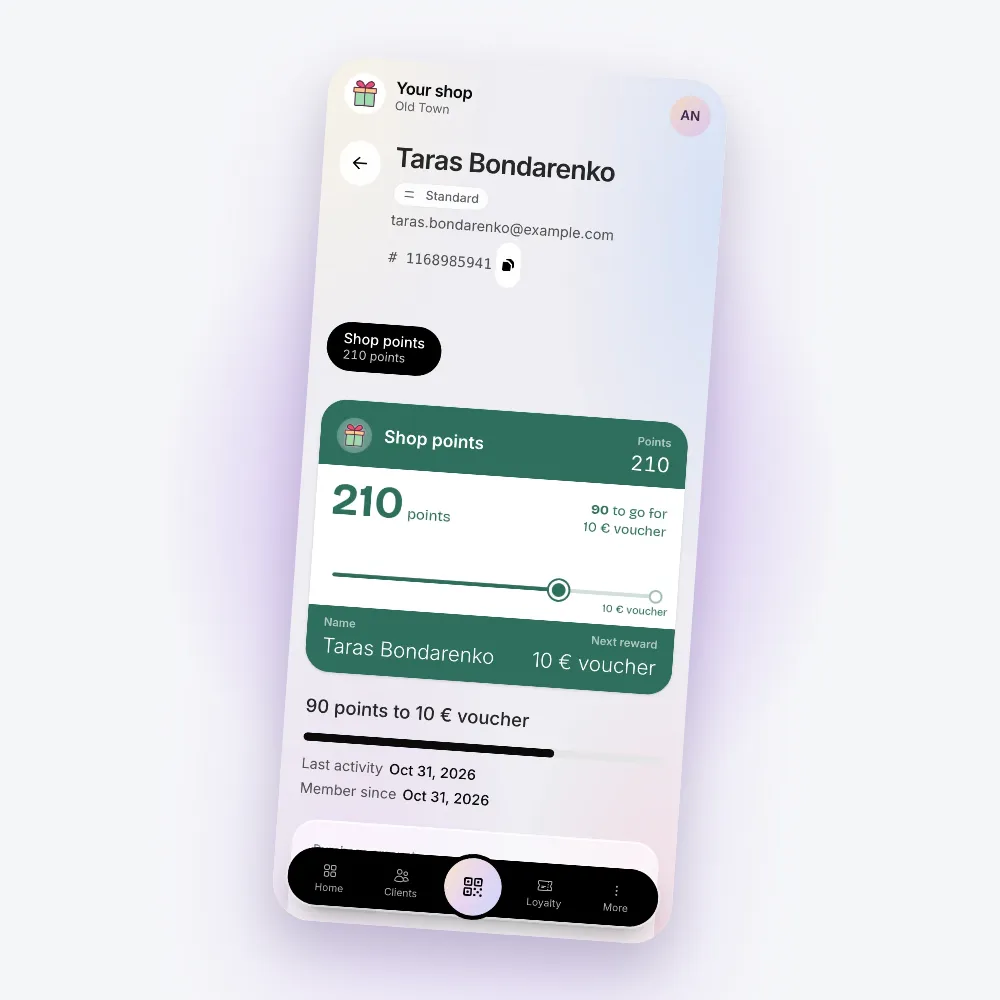
This is where a card earns its place. With Loyalius, a loyalty platform that puts stamp, points and cashback cards in Apple Wallet and Google Wallet, the same card works in every branch, and you can see per branch how many new members come back (branch reports are part of the Pro plan). A reminder to people who have not been in for a few weeks then goes out on its own. Our loyalty program for retail shops shows how the points card works on a shop floor.
If the basket is smaller
A smaller receipt is the cheapest gap to close, because the customers are already at the counter. Check that the range fits the street (families buy bigger packs and fewer gifts), that last-minute extras sit next to the till, and that staff suggest one thing a week, the same in every branch, so you can compare.
Give the branch a target it can reach
Do not ask Branch 5 to become the typical branch by next month. Ask it to move one number. If visits per customer go from 3.0 to 3.4 while the rest stays the same, the branch sells about 8,830 € more a month (1,600 × 0.4 × 13.80 €). That is a goal a manager can picture: a few hundred extra visits from people who already know the shop.
Show the branch manager the three numbers, not a league table. A ranking tells them they are last; the three numbers tell them what to do on Monday. Look again after eight weeks, against the branch's own starting point, and read the results with the method in our guide to measuring a loyalty programme.
Questions from people who run several shops
How long should a new branch get before you judge it?
Give it at least a year, so that it has been through every season once and has had time to build regulars. Before that, watch whether visits per customer are rising month by month, which matters more than total sales.
Should I close an underperforming store?
Not before you know which of the three numbers is behind. A branch with too few customers on a street that will not change may be worth closing, but a branch with plenty of customers who do not return has a problem you can fix inside the shop.
Will a discount campaign help a weak branch?
It brings in people for the discount, which only helps if footfall is the problem. If customers are not coming back, a discount fills the shop for a week and teaches people to wait for the next one.
Spend one Saturday morning there
Before you build the spreadsheet, work a Saturday morning at the weak branch, behind the counter and not in the office. You will see the queue, the shelf and the till with your own eyes, and when the three numbers arrive, you will already have a guess which one is low. My bet is that it is the one about coming back.
More stories
 Regular customers stopped coming? How to spot it early and win them back
Lost regulars rarely leave in anger. How to see who has gone quiet, why they drift away, and how to bring them back with one small reason and a date.
 Should you close your restaurant on slow days? Do this sum first
Quiet Mondays? Work out what the day really earns, how many guests would beat closing it, and how to fill it if it is worth keeping. A bistro example.
 How to get staff to upsell when they hate sounding pushy
Staff never recommend anything? Give them one product, one sentence and one moment at the till each week, then count. A bakery example with the sums.